
Top Traffic Sources Global vs. Europe
The overall traffic generation picture is similar to what you’d expect from an ecommerce brand—the absolute majority of traffic is direct.
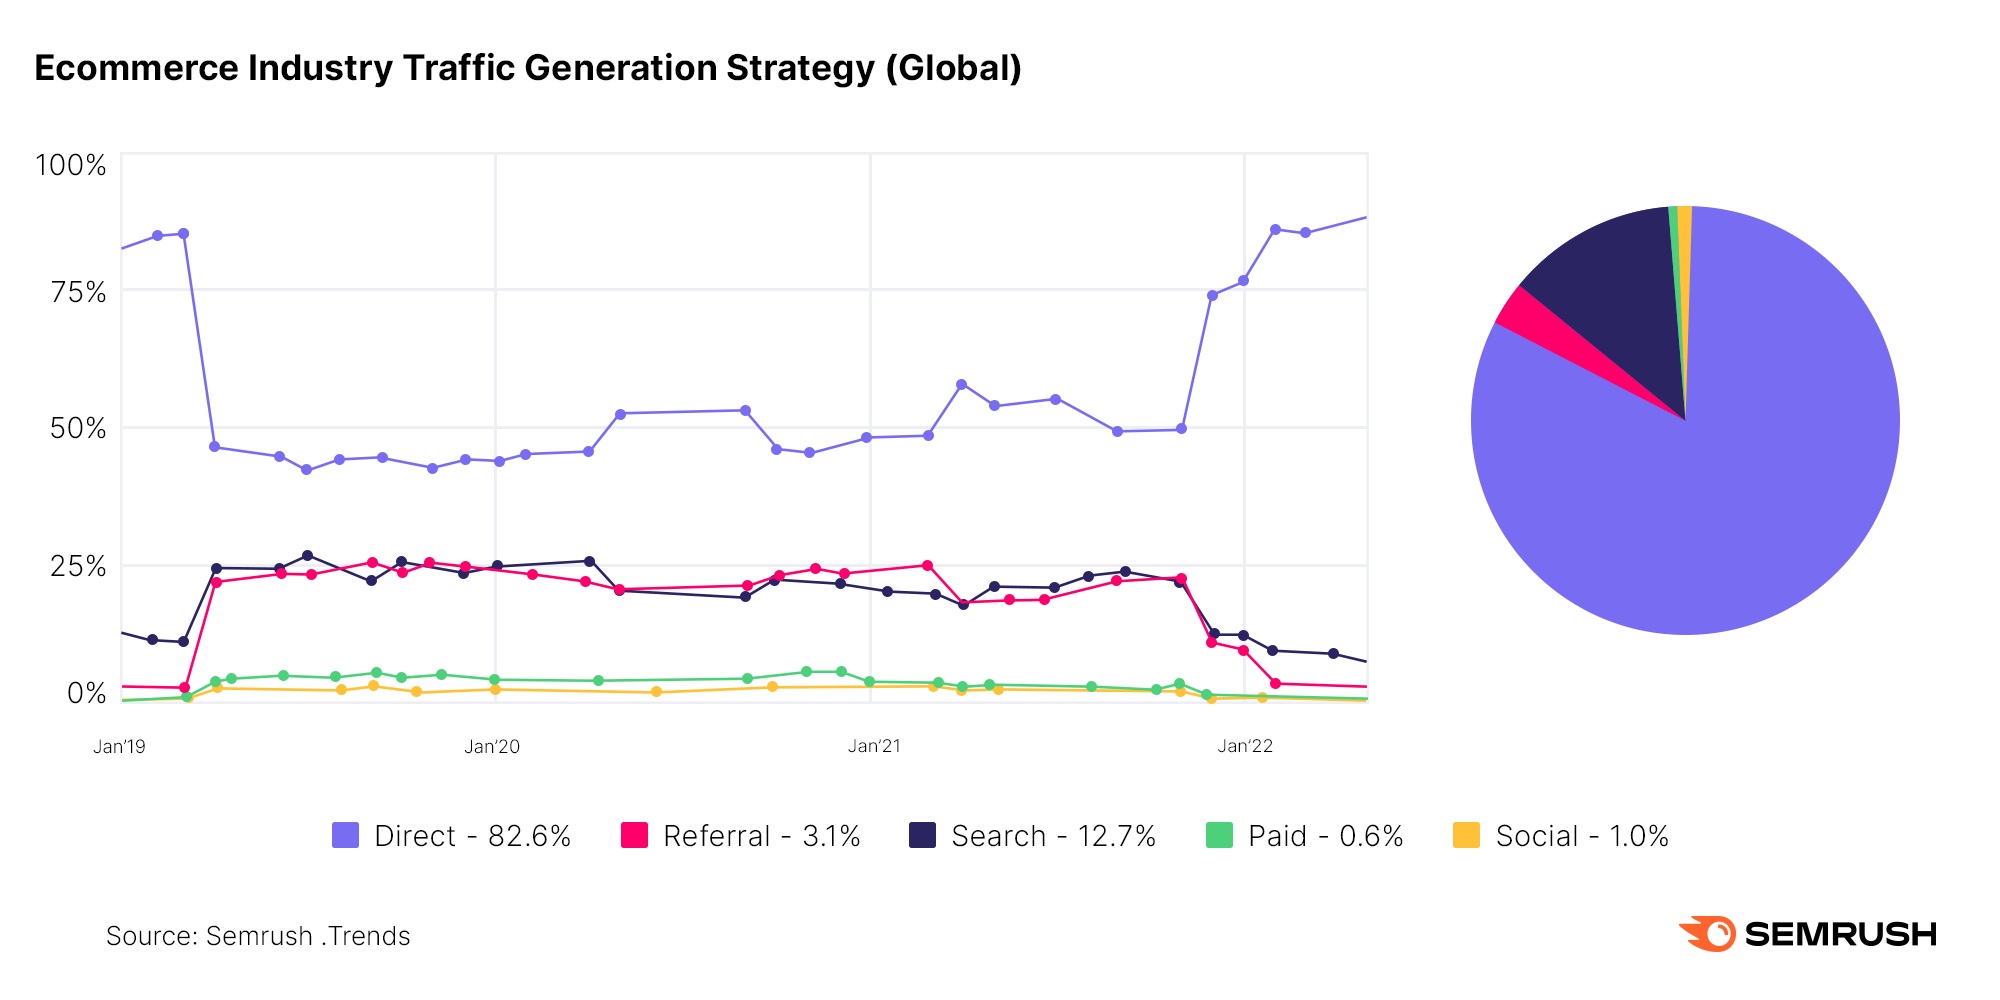
This implies that brand awareness is the most powerful tool in any ecommerce marketer’s toolbox. Direct traffic has always accounted for the largest share of traffic within the ecommerce space, and this trend only grew throughout the pandemic.
At the end of 2021, however, the surge in direct visits marked a return to pre-pandemic levels and has continued to grow ever since. As of today—direct visits make up more than 83% of all ecommerce traffic across the globe.
When considering individual regions in isolation, however, we discover some variations. Looking to Europe, for example, we uncover some distinctions compared to the global trends.
While globally, there has been a comeback of direct traffic in 2022, the European ecommerce market hasn’t seen such a steep increase. Likewise, search traffic in Europe has been on an upward trend, pointing to the importance of a strong SEO strategy.
Market Size by Location
Every market has untapped growth potential. To explore the potential of the ecommerce market, we examined audiences for the top ecommerce players in each region to figure out the growth potential.
For example, this graph compares the ecommerce markets of various countries within Latin America.
Looking at demand stats for products Latin American e-tailers offer (based on keyword volumes and traffic to these keywords) alongside data related to the size of the audience, we’re able to generate metrics for the Total Addressable Market and the Serviceable Available Market.
Total Addressable Market (TAM) represents the amount of demand within the market, or the market’s maximum potential. Since each individual consumer can represent more than one unit of demand–for example, parents with infants buy diapers over and over again, generating multiple units of demand–this number is typically larger than the individual number of market customers.
Serviceable Available Market (SAM) is more sales-focused and represents the share of consumers who need, want, can afford, and are ready to buy a product. It shows how many sales you could potentially see if you held a 100% market share within the ecommerce space in the US.
In LATAM’s case, the market size for ecommerce follows the usual economic logic—Brazil, the regional economic leader, has twice the market potential of Mexico (the second economic power within the region). Argentina, with its booming ecommerce market and constant inflation crisis, comes third.
The full report offers similar graphs for the US and European countries.
3 Key Insights from the Ecommerce Report
While the Key 2022 Ecommerce Trends report is loaded with useful insights, we wanted to offer a few based on the sampling of data we shared in this post.
Ecommerce will continue growing, but with a slowing growth rate, depending on market growth alone won’t be enough to find success. Businesses should focus on a strong data-informed marketing strategy for growth moving into the future.
Top players, traffic trends, and market potential show a great deal of variation by region. Getting specific about the region you're targeting and analyzing the data is key for success in today’s ecommerce landscape.
Top products and ad strategies also vary by region. When looking to increase your impact in your home market or break into new markets, knowing what local customers want and need is crucial.
In this post, we’ve just scratched the surface of this exciting industry. And if history tells us anything, there will be plenty of exciting opportunities to come. In this rapidly changing industry, staying ahead of the curb is key for success. For more data and insights on emerging ecommerce trends, be sure to download the full Key 2022 Ecommerce Trends report.